Your BringShare SEO Dashboard is jam-packed with all of the SEO reporting information you need to prove the value of your SEO. This post is the 3rd post in a 5 part breakdown of key BringShare SEO reporting insights. The SEO Dashboard is composed of 5 components: a breakdown of information by Search Engines, a Traffic Breakdown analysis, an overview of Top Keywords driving traffic and conversions to your client’s site, information on keyword Rankings and an analysis of links leading to your client’s website brought via Moz . This post talks about the Top Keywords Tab specifically, but click any of the links above to learn more about the other sections as well!
Key Insights from your top keywords tab to share with clients during SEO reporting
1) Give your client a qualitative view of all of the top keywords driving visits and conversions/revenue to their site
Sometimes clients can be confused and overwhelmed with industry terminology and jargon. There can be difficulties defining the term SEO, let alone understanding the importance of external linking domains vs pages, domain authority, page rank and more.
Sometimes it’s just amazing to say: “These are the top things people searched to get to your website.” Short, sweet, and to the point with no confusion.
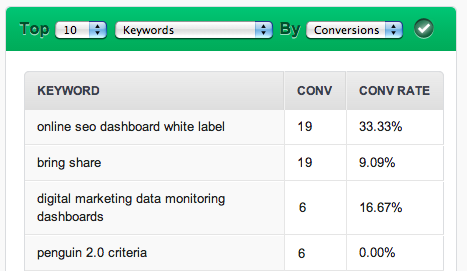
Sort your Top Keywords charts by Top 10-25 Keywords to show your clients a quick snapshot of which keywords are driving the most organic traffic. Viewing your top keywords (without segmenting down to branded or non-branded) in both the visits and conversion/revenue tables can help you identify:
- the specific number of visits and conversions coming from top keywords -regardless of branded vs non-branded.
- the specific SEO keywords that are being effective for your client. This chart is a great, visual way to help your clients understand their current state of SEO.
2) Explore branded keywords to identify which drive traffic and which have a true impact
 As we learned in the Traffic Breakdown Analysis post, reporting on branded keywords driving traffic to your client’s site is a great way prove to your clients that the SEO work you’re doing is helping people looking for their brand easily find it. Not only that, but branded traffic can be the most valuable segment of traffic. Digging deeper into your top branded traffic gives your client a more qualitative understanding of what specific branded keywords are having an impact.
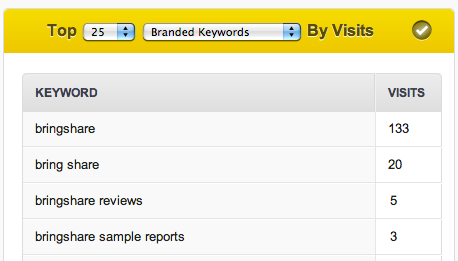
Sorting the “Top Keywords” charts in BringShare by “Branded Keywords” provides the opportunity for you to show your clients:
- the top branded keywords that are sending traffic to your client’s site
- the volume of traffic (by viewing number of visits) each specific keywords is driving
- and how valuable that traffic is (by viewing number of conversions or the conversion rate associated with each specific keyword)
3) Explore branded keywords to identify new opportunities
Sorting by branded keywords can also provide you with valuable insights into what people are searching for that your client’s website may not be easily providing -or worse yet, not providing at all. There is a reason they’re using a search engine rather than looking it up on your client’s site. By understanding the main questions visitors are looking to answer through branded keywords, you can discover new opportunity: new content to add to your client’s website, new ways of providing a call-to-action, new ways to connect with your client’s customers and more.
All-in-all, understanding branded keyword queries helps you find new ways to help keep your client’s customers (or potential customers) happy.
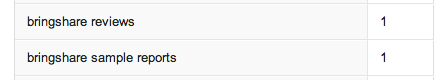 For example, if “Company Name reviews” is a top keyword driving traffic to your client’s site -perhaps work with your client to get a more prominent review section set up so visitors can find it right away (allowing you to control what reviews your client’s potential customers find and also set up a call-to-action button prominently next to this new section to easily capture further leads). In that same light, if “Company Name contact information” is a typical branded query, perhaps you should recommend that your client display that info more prominently on their site.
The lesson: branded keywords help you understand what your client’s customers are looking for. Pay attention to what people are saying and it can truly pay off!
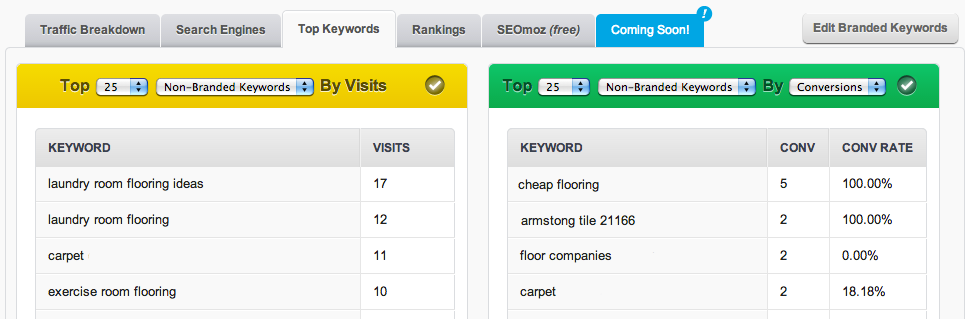
4) View non-branded keywords by visits, conversions/revenue and conversion rate
Now that we have done a thorough analysis on our branded keywords driving traffic, it’s time to look at the non-branded keywords. Viewing your graphs at the non-branded keyword level is the perfect way to show the results you have generated via your SEO campaigns. First, take a look at the top non-branded keywords. Do you see the keywords you’re optimizing for? Of course you do. Point this out to your client. Your Top Keyword graphs are a great way to show your client qualitative data that they can easily understand.
Next, look for the keywords that are slightly more interesting -or even surprising for that reporting period. Are there any new non-branded keywords that seem to be driving more traffic or conversions/sales for your client’s website that you don’t usually see? If so, perhaps it’s time to dig a bit deeper into keyword research there to identify if there are further opportunities for increasing rankings, or optimizing your client’s site further for those terms.
The Top Keywords Tab - What is included?
The Top Keywords By Visits Graph:
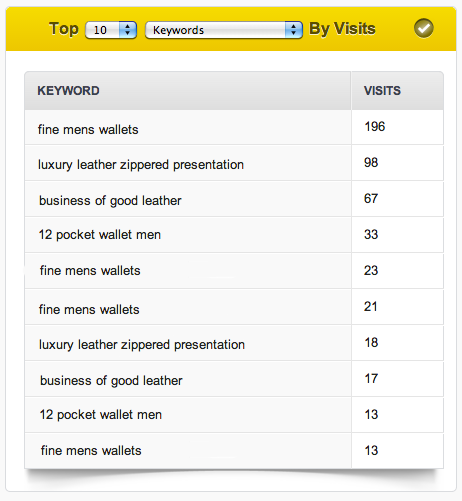
The Top SEO Keywords by visits graph allows you to explore the top 10, 20 -or even up to 500 keywords that are driving organic traffic to your client’s site. You are also able to filter these keywords by branded vs non-branded terms.
The Top Keywords By Conversions/Revenue or Conversion Rate Graph:
The Top SEO Keywords by conversions (or revenue, if you’re an ecommerce client) graph displays the top searched terms that have not only sent traffic to your client’s site, but that have also converted via a Google goal or a purchase. Like the visits table, you are also able to filter these keywords by branded vs non-branded terms and select up to 500 to be viewed at one time.
A tip when using the BringShare Top Keywords dashboard:
Customize your data to display just the way you would like to view it.
Use the first dropdown option to show more (up to 500) or less (the standard 10) keywords! Your BringShare Dashboards automatically default to display the top 10 keywords, but once you make another selection, this now becomes the number of keywords you see in your dashboard, as well as within any future reports you generate. Whatever you have selected is what will be included in your report.

Select 10-500 keywords to view at one time in your BringShare Top Keywords tab.
Use the second dropdown option to sort through those keywords by branded, non-branded, or all keywords. Again, whatever you have selected is what will be included in the future reports you generate.
- If you select “Keywords”, you’ll see the keywords sending the most traffic or conversions to your client’s site. This will include both branded and non-branded keywords.
- If you select “Branded Keywords”, this table will now show you the top keywords that have also been specified as branded.
- Need help here? Learn more about entering branded keywords into BringShare settings.
- Need help here? Learn more about entering branded keywords into BringShare settings.
- If you select “Non-branded Keywords”, this table will now show only your top non-branded keywords.

Easily sort your top keywords by branded, non-branded or all keywords.
Use the third dropdown option to sort through your keywords and filter by Conversions (for leads based users), Revenue (for ecommerce based users) or Conversion Rate (included on the dashboard for both types).
- If you select Revenue/Conversions, you’ll continue to see both metrics, but the keywords will sort first by the highest number of conversions, or highest amount of revenue generated by those top keywords.
- If you select Conversion Rate, the keyword will then sort first by the highest conversion rate.
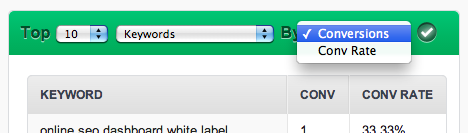
Easily sort your top keywords by conversions or conversion rate.
Now that you have learned more about the Top Keywords tab of your SEO Dashboard, read up on the other 4 sections!
- Traffic Breakdown analysis
- An breakdown by Search Engine
- Keyword Rankings (blog post coming soon)
- SEOmoz data (blog post coming soon)
Haven’t discovered BringShare reporting for agencies?
Learn more about how the BringShare SEO Dashboard can automate your agency reporting.